
Webhooks and the processing of them are a big part of Rewind backups. We’re now processing over 300 million hooks per month at a peak rate of approx 190 hooks per second. We’ve written before about a scalable method for processing large volumes of webhooks and also how to enhance the performance with simple caching. Recently, we embarked on a project to further improve our webhook handling and processing with 2 main goals:
- Could we do it in a more cost-effective way?
- Could we give our users a better experience?
In both cases the answer was yes. Let’s look at the changes we made.
Recap – Webhook Processing Architecture
Let’s recap how we process webhooks today before talking about the changes we’ve made
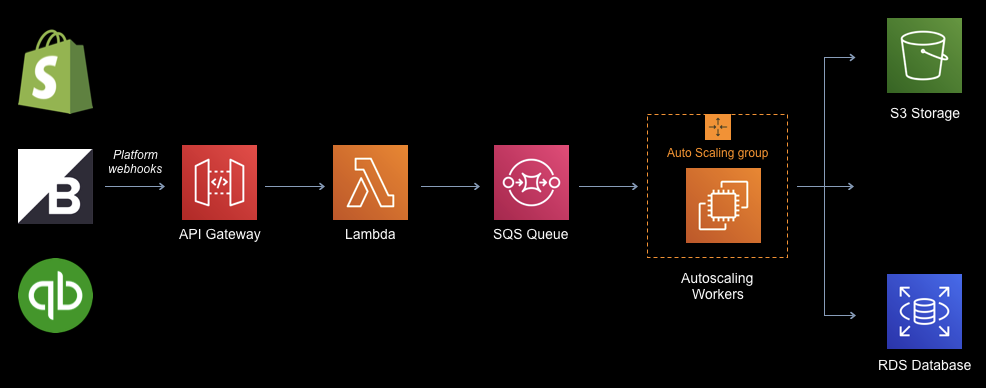
- Webhooks are ingested from the platforms we backup (3 today but the architecture is generic) into a Lambda function via API Gateway
- The Lambda function routes the incoming hook to a regional SQS queue depending on the platform geo-location
- A tier of workers poll the queue and process the webhook. Generally, each webhook involves us backing up an item or items to data stores
Change 1 – Use HTTP APIs
We’ve been using API gateway to process and route the incoming webhooks to Lambda functions now for a few years. As the volume of webhooks has increased, so has our API Gateway costs. In April 2020, we were spending just over $1,000/month for processing just over 300 Million requests. This is before any business logic is invoked. Not insignificant.
In December 2019, AWS released HTTP APIs for API Gateway. These are less full featured than the full REST APIs but are priced significantly cheaper than the REST APIs. After doing some testing, we determined that we actually did not need any of the extra processing REST APIs provided and further, the Lambda proxy event used by HTTP APIs is easier to process.
By switching to HTTP APIs for the API gateway processing, we’ve lowered our costs from $3.50/million requests to $1/million requests. In real money, that’s going from just over $1,000/month to around $300/month. Success!
Change 2 – Aggregate Webhooks
This change took a bit more work and is the main focus of this article. What do we mean by aggregating webhooks?
Suppose you have an e-commerce store and you update the same product listing 50 times in a 3 minute period (maybe you have an app that is doing these updates). This would generate 50 webhooks with updates for the same product which in turn, Rewind would process and backup the product 50 times. In our UI, you would see 50 versions of this product and could restore to any of these 50 versions.
Aggregating webhooks means taking these 50 changes over this 3 minute time period and condensing them to one update. In Rewind, this means one version viewable in the backup vault which can be restored. We’ve found that this is a more appealing user experience as most of the versions created are very minor changes.
Aggregation of webhooks has another benefit on the cost side since each webhook processed generates a number of API PUT operations to AWS S3 (our main data store). To the point where we actually pay more for API operations than we do to store the content!
Let’s drill into how we went about aggregating webhooks in a generic fashion.
Change Tracking
The core methodology is tracking the updates to an item within a time window (configurable, we’re using 5 minutes to start with). This means all updates to the same item in the same store/account within a 5 minute window will be considered to be “one change”.
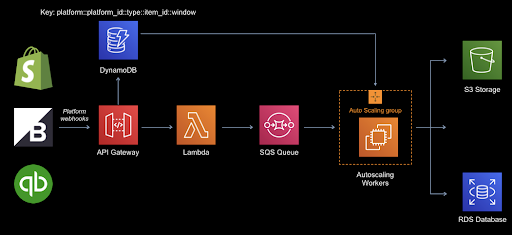
We use a DynamoDB table to track the updates along with the associated SQS message ID which represents “this” webhook. The Lambda function writes to the DynamoDB table and the downstream workers read from this table to see if they need to process the current message.
Ingest Lambda Function
The ingest lambda function is where the bulk of the work takes place to aggregate the incoming webhooks. The process uses the DynamoDB table and SQS as follows:
Each row in DynamoDB has a composite key consisting of
platform::platform_id::item_type::item_id::window
For example, for a product in a Shopify store, it might look like:
shopify::mystore.myshopify.com::products::5678::1591373400
The window is the end of the window specified as epoch time.
What else is in the DynamoDB row? There’s 3 other attributes:
- The SQS message ID
- An arrival time
- A DynamoDB TTL field
For each incoming webhook, we compute the aggregation window:
roundedTimestamp(window) {
   const windowMilliseconds  = window * 1000;
   const now = new Date();

   return Math.round(
     (Math.ceil(now.getTime() / windowMilliseconds)
       * windowMilliseconds)
     / 1000);
 }
Once we have the aggregation window, we compute the composite key and post the webhook body to SQS. The composite key is added as a message attribute to the SQS message in order that the downstream workers can decide if they need to process “this” message or not (more below).
When posting the webhook content to SQS for later processing, we set a delay time before the message will become visible to any readers processing the queue. This delay time is equal to the remaining time in the window plus a small factor to allow for DynamoDB consistency.
Finally, we can now upsert the row in DynamoDB for the computed key. The row adds in the SQS message ID (returned from posting to SQS) such that by the end of the window, we will have the final SQS message ID of the webhook we actually want to process.
When processing close to 200 webhooks per second, we have many Lambda executors running concurrently. We don’t want to end up with an older webhook being the last one we process so we track the arrival time and use a conditional update to only update the row if the arrival time is greater than the value we have already stored. The conditional update looks like
let updated = await DynamoDB.updateItem({
    TableName: this.tableName,
    Key: {
      'partitionKey': {
        S: key
      }
    },
    UpdateExpression: 'SET messageId = :messageId, arrivalTimestamp = :arrivalTimestamp, #expiry = :expiry',
    ConditionExpression: 'arrivalTimestamp <= :arrivalTimestamp or attribute_not_exists(partitionKey)',
    ExpressionAttributeNames: {
      "#expiry": 'ttl'
    },
    ExpressionAttributeValues: {
      ':messageId': {
        S: messageId
      },
      ':arrivalTimestamp': {
        // Unlike all other timestamps inputted and outputted (which are in seconds) this will remain in milliseconds
        // as that precision is vital in this case
        N: timestamp.toString()
      },
      ':expiry': {
        N: this.expiry().toString()
      }
    },
    ReturnValues: 'UPDATED_OLD'
  }).promise();
This whole process is repeated for each incoming hook with the aggregation window sliding every configured interval (5 minutes for example).
Downstream Webhook Workers/Processors
So the Lambda function has been pushing messages to SQS with a delay time and updating rows in DynamoDB. What do the downstream workers do? Their role is fairly straightforward:
- At the expiry of the delay timer, all of the messages for the current window become visible in the queue.
- The workers read all of these and pull out the message attribute which is the DynamoDB key
- DynamoDB is queried for the key and the simple comparison of “is the message ID field equal to the current message ID being read” is performed
- If the ID in DynamoDB does not match the current message ID, we drop the message
There’s protection in the code to be permissive if we cannot communicate with DynamoDB or if the key does not exist for some reason. We set the DynamoDB TTL to 3 days for the aggregation records which allows some time if we ever had a problem processing the queue or if we need to take the downstream workers offline for any reason.
I know what you’re thinking…why even write the messages to SQS in the first place if they are just going to be discarded? The initial plan was to write the webhook body to DynamoDB and only write a single message to SQS pointing to the primary key. However, after computing the cost of the DynamoDB write throughput we would need to support this, we elected to continue posting to SQS and discarding messages we no longer need to process.
The other factor against posting the entire body to DynamoDB is that some platforms send only the ID of the item changing whereas others send the full body of the item. This can result in a multi-megabyte body which is greater than the 400K maximum item size for DynamoDB.
Multi-megabyte body webhooks also posed a problem for SQS which has a maximum message size of 256K. We don’t receive very many of these large hooks (less than 0.02%) so we strip the body down to the bare essentials (the ID and some metadata) and signal the downstream processors they will need to backup this item directly from the platform.
That’s the main architecture for aggregating the webhooks. We realised some other benefits which were pretty key as well though. Let’s look at those.
Change 3 – Lambda Optimizations
We want to process all of the webhooks as quickly as possible in the Lambda function both for cost purposes and so we can respond to the platform generating the hook in a timely manner.
Parameter Store
Our function needs some secrets which we store in AWS Parameter store. Hitting parameter store for every execution of the function would be expensive in terms of time but also in terms of cost. As a result we used a common Lambda best practice and retrieved the secrets outside of the Lambda handler and cache them in memory in the execution environment.
Looking at some metrics over a day using the outstanding Cloudwatch Log Insights service, we were able to look at the number of parameter store calls we had saved in a day by utilizing simple caching. In a one day period we had 9M executions and of these 8,500 were cold starts. We have 4 parameters stored in parameter store so we made 34,000 calls to get parameters rather than 36,000,000!
This simple Cloudwatch Log Insights query reports back on Lambda cold starts
filter @type = "REPORT"
| filter @message like /(?i)(Init)/
| stats count(*)
One other note on parameter store. We found we were being throttled reading values occasionally but especially when we updated our Lambda function code. Parameter store has an option to enable high throughput mode but this comes with a dollar cost. Rather than API requests to parameter store being free, enabling high throughput mode introduces a cost of $0.05/10,000 requests. Once again, it’s caching to the rescue as this will only cost us $0.17/day which is a small price to eliminate throttling errors when reading our secrets
DynamoDB
Our Lambda function needs to route webhooks to queues in different AWS regions. As such, much like with parameter store, we cache the DynamoDB clients outside the handler in a small array. The client is created on the first request for a region and persists for the life of the execution environment. This saves a great deal of time in not having to re-create the client each time.
The second optimization around DynamoDB was found in this excellent blog post by Yan Cui (The Burning Monk) involving enabling TCP keepalive for DynamoDB client connections. It turns out that newer nodejs AWS SDKs support this by just setting the environment variable
AWS_NODEJS_CONNECTION_REUSE_ENABLED=1
What could be easier?! We’re packaging our function and other pieces with AWS SAM so it’s trivial to add this to the SAM template and we saw the same impact on execution time documented by Yan in his blog post.
Reporting
Following the “you can’t improve what you can’t measure” mantra, we wanted some insight into how many webhooks were actually going to be aggregated. We had an idea it was significant but it was just a feeling. What metrics could we pull together and how could we do this?
Enter Cloudwatch Log Insights. This allows you to process massive arounds of log data and produce reports, dashboards, etc. We had used this in a limited capacity in the past but it quickly became “the” solution for generating incredibly rich intelligence for our webhook ingest.
Cloudwatch Log Insights works by processing Cloudwatch log streams and parsing the log messages so you can produce stats. There’s some good example queries to examine Lambda logs and we wondered if we could use this?
The key was having our Lambda function output a json “stats” record for each operation. Log lines in json are automatically parsed into fields by Insights so we started adding a record like this to the log at the end of each execution:
{
  source: 'dedupe',
  classifier: ‘dupe’,
  pod: pod-1,
  platform: 'shopify',
  domain: mystore.myshopify.com',
  action: ‘update’,
  type: 'orders',
  id: 5678
}
The classifier field we gave one of 2 values for – new or dupe. If the hook was being aggregated (ie. it was greater than the first time we had seen this item in the window), we would set the classifier to dupe. Otherwise, it would be set to new. We can then run queries like this in Cloudwatch Insights
fields @timestamp, @message, source, classifier, pod, platform, domain, action, type, id
| filter source = "dedupe" and classifier = "dupe"
| stats count(*) as aggregated by platform, type
| sort aggregated desc
This gives us results like:
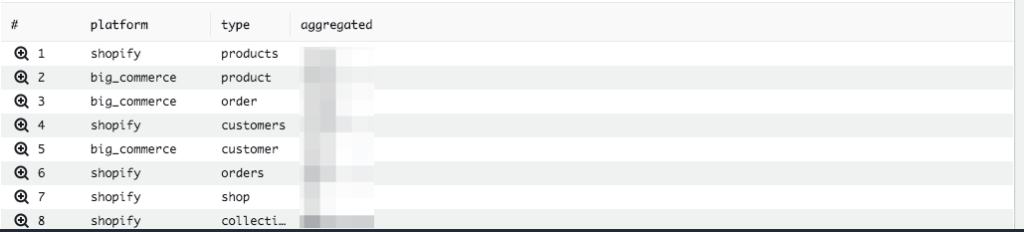
Fantastic! What else can we determine? How about the number of hooks we route to a specific pod (take a look at this past post for information on what a pod is)? Sure can.
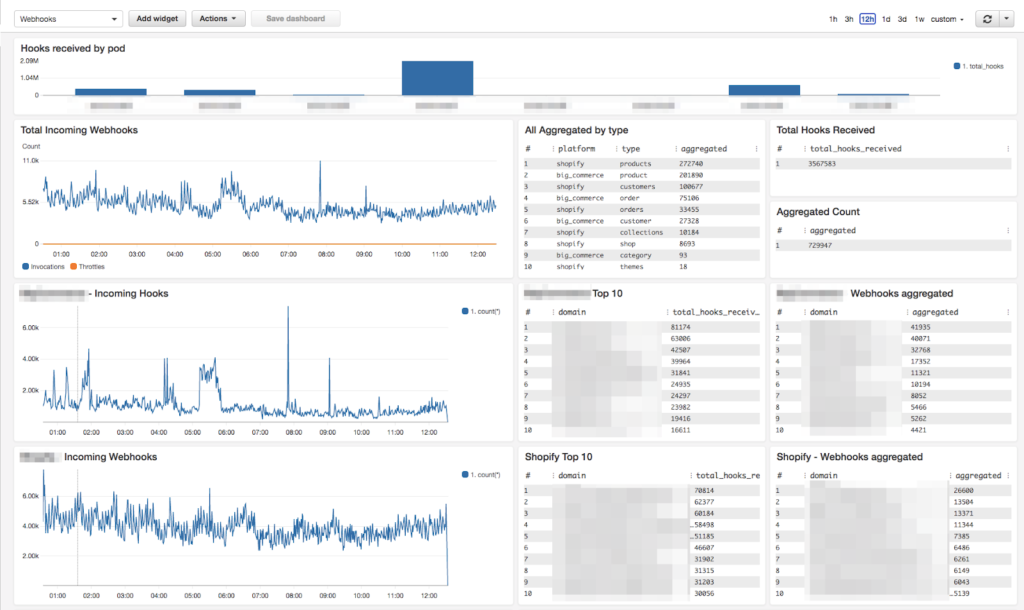
fields @timestamp, @message, source, classifier, pod, platform, domain, action, type, id
| filter source = "dedupe" and ispresent(pod)
| stats count(*) as total_hooks by pod
| sort total_hooks des
There’s many more queries we run to slice and dice the webhook ingest based off this single stat record. The other bonus is Insights can be added to a Cloudwatch dashboard for a ‘single pane of glass’ view of our ingestion and processing.
Wrapping up
We’ve had this in production for some time now and we’ve found that using a 5 minute aggregation window, we are achieving an aggregation rate of around 20%. That’s a nice cost saving improvement while at the same time making our product more usable. Everything is fully tunable by configuration parameters so we can easily make changes in the future if we find we need to tweak the window.
As usual with AWS services, it’s making them work together that provides the high value. Being able to use Lambda, DynamoDB, SQS and Cloudwatch Insights together gives us a very powerful solution.
We’re hiring. Come work with us!
We’re always looking for passionate and talented engineers to join our growing team.
View open career opportunities Dave North">